|
|
市場調査レポート
商品コード
1719383
合法的傍受(LI)の世界市場 2025~2029年Global Lawful Interception (LI) Market 2025-2029 |
||||||

|
|||||||
カスタマイズ可能
|
|||||||

| 合法的傍受(LI)の世界市場 2025~2029年 |
|
出版日: 2025年04月17日
発行: TechNavio
ページ情報: 英文 245 Pages
納期: 即納可能
|

全表示
- 概要
- 図表
- 目次
合法的傍受(LI)市場は2024-2029年に222億3,880万米ドル、予測期間中のCAGRは36.9%で成長すると予測されます。
当レポートでは、合法的傍受(LI)市場の全体的な分析、市場規模・予測、動向、成長促進要因、課題、約25のベンダーを網羅したベンダー分析などを掲載しています。
現在の市場シナリオ、最新動向と促進要因、市場環境全体に関する最新分析を提供しています。市場は、犯罪やテロに対する脆弱性の増加、合法的傍受を規定する基準や規制への企業のコンプライアンス、データトラフィック量の増加とセキュリティ脅威によって牽引されています。
| 市場範囲 | |
|---|---|
| 基準年 | 2025 |
| 終了年 | 2029 |
| 予測期間 | 2025-2029 |
| 成長モメンタム | 加速 |
| 前年比2025年 | 28.6% |
| CAGR | 36.9% |
| 増分額 | 222億3,880万米ドル |
本調査は、業界の主要参加者からのインプットを含め、一次情報と二次情報を客観的に組み合わせて実施しました。レポートには、主要企業の分析に加え、包括的な市場規模データ、地域分析によるセグメント、ベンダー情勢が含まれています。レポートには過去データと予測データがあります。
本調査では、合法的傍受ソリューションの企業による最近の動向が、今後数年間の合法的傍受(LI)市場の成長を促進する主要な理由の1つであると特定しています。また、仮想化された合法的傍受の人気の高まりと、LTEネットワークの使用の増加は、市場の大きな需要につながります。
目次
第1章 エグゼクティブサマリー
- 市場概要
第2章 Technavio分析
- 価格・ライフサイクル・顧客購入バスケット・採用率・購入基準の分析
- インプットの重要性と差別化の要因
- 混乱の要因
- 促進要因と課題の影響
第3章 市場情勢
- 市場エコシステム
- 市場の特徴
- バリューチェーン分析
第4章 市場規模
- 市場の定義
- 市場セグメント分析
- 市場規模 2024
- 市場の見通し 2024-2029
第5章 市場規模実績
- 合法的傍受(LI)の世界市場 2019-2023
- エンドユーザー別セグメント分析 2019-2023
- コンポーネント別セグメント分析 2019-2023
- タイプ別セグメント分析 2019-2023
- 技術別セグメント分析 2019-2023
- 地域別セグメント分析 2019-2023
- 国別セグメント分析 2019-2023
第6章 定性分析
- AIの影響:合法的傍受(LI)の世界市場
第7章 ファイブフォース分析
- ファイブフォースの要約
- 買い手の交渉力
- 供給企業の交渉力
- 新規参入業者の脅威
- 代替品の脅威
- 競争の脅威
- 市況
第8章 市場セグメンテーション:エンドユーザー別
- 市場セグメント
- 比較:エンドユーザー別
- 法執行機関:市場規模と予測 2024-2029
- 企業:市場規模と予測 2024-2029
- 市場機会:エンドユーザー別
第9章 市場セグメンテーション:コンポーネント別
- 市場セグメント
- 比較:コンポーネント別
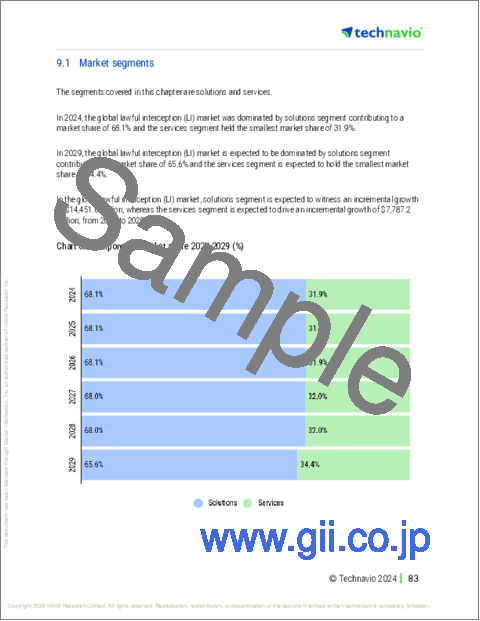
- ソリューション:市場規模と予測 2024-2029
- サービス:市場規模と予測 2024-2029
- 市場機会:コンポーネント別
第10章 市場セグメンテーション:タイプ別
- 市場セグメント
- 比較:タイプ別
- 音声通信:市場規模と予測 2024-2029
- データ通信:市場規模と予測 2024-2029
- メッセージングサービス:市場規模と予測 2024-2029
- ソーシャルメディアとクラウドベースのコミュニケーション:市場規模と予測 2024-2029
- 市場機会:タイプ別
第11章 市場セグメンテーション:技術別
- 市場セグメント
- 比較:技術別
- ワイヤレスネットワーク:市場規模と予測 2024-2029
- ブロードバンドネットワーク:市場規模と予測 2024-2029
- ロングタームエボリューション(LTE):市場規模と予測 2024-2029
- ボイスオーバーインターネットプロトコル(VoIP):市場規模と予測 2024-2029
- 市場機会:技術別
第12章 顧客情勢
- 顧客情勢の概要
第13章 地域別情勢
- 地域別セグメンテーション
- 地域別比較
- 北米:市場規模と予測 2024-2029
- 欧州:市場規模と予測 2024-2029
- アジア太平洋:市場規模と予測 2024-2029
- 中東・アフリカ:市場規模と予測 2024-2029
- 南米:市場規模と予測 2024-2029
- 米国:市場規模と予測 2024-2029
- ドイツ:市場規模と予測 2024-2029
- 中国:市場規模と予測 2024-2029
- カナダ:市場規模と予測 2024-2029
- 日本:市場規模と予測 2024-2029
- 英国:市場規模と予測 2024-2029
- フランス:市場規模と予測 2024-2029
- インド:市場規模と予測 2024-2029
- イタリア:市場規模と予測 2024-2029
- オランダ:市場規模と予測 2024-2029
- 市場機会:地域情勢別
第14章 促進要因・課題・機会・抑制要因
- 市場促進要因
- 市場の課題
- 促進要因と課題の影響
- 市場の機会・抑制要因
第15章 競合情勢
- 概要
- 競合情勢
- 混乱の状況
- 業界のリスク
第16章 競合分析
- 企業プロファイル
- 企業ランキング指数
- 企業の市場ポジショニング
- AQSACOM Inc.
- BAE Systems Plc
- Cisco Systems Inc.
- Dreamlab Technologies AG
- Incognito Software Systems Inc.
- IPS Intelligence and Public Security Spa
- Keysight Technologies Inc.
- Musarubra US LLC
- Pert Telecom Solutions Pvt. Ltd.
- Progress Software Corp.
- SS8 Networks Inc.
- Telefonaktiebolaget LM Ericsson
- Utimaco GmbH
- Verint Systems Inc.
- ZTE Corp.
第17章 付録
Exhibits:
- Exhibits1: Executive Summary - Chart on Market Overview
- Exhibits2: Executive Summary - Data Table on Market Overview
- Exhibits3: Executive Summary - Chart on Global Market Characteristics
- Exhibits4: Executive Summary - Chart on Market By Geographical Landscape
- Exhibits5: Executive Summary - Chart on Market Segmentation by End-user
- Exhibits6: Executive Summary - Chart on Market Segmentation by Component
- Exhibits7: Executive Summary - Chart on Market Segmentation by Type
- Exhibits8: Executive Summary - Chart on Market Segmentation by Technology
- Exhibits9: Executive Summary - Chart on Incremental Growth
- Exhibits10: Executive Summary - Data Table on Incremental Growth
- Exhibits11: Executive Summary - Chart on Company Market Positioning
- Exhibits12: Analysis of price sensitivity, lifecycle, customer purchase basket, adoption rates, and purchase criteria
- Exhibits13: Overview on criticality of inputs and factors of differentiation
- Exhibits14: Overview on factors of disruption
- Exhibits15: Impact of drivers and challenges in 2024 and 2029
- Exhibits16: Parent Market
- Exhibits17: Data Table on - Parent Market
- Exhibits18: Market characteristics analysis
- Exhibits19: Value chain analysis
- Exhibits20: Offerings of companies included in the market definition
- Exhibits21: Market segments
- Exhibits22: Chart on Global - Market size and forecast 2024-2029 ($ million)
- Exhibits23: Data Table on Global - Market size and forecast 2024-2029 ($ million)
- Exhibits24: Chart on Global Market: Year-over-year growth 2024-2029 (%)
- Exhibits25: Data Table on Global Market: Year-over-year growth 2024-2029 (%)
- Exhibits26: Historic Market Size - Data Table on Global Lawful Interception (LI) Market 2019 - 2023 ($ million)
- Exhibits27: Historic Market Size - End-user Segment 2019 - 2023 ($ million)
- Exhibits28: Historic Market Size - Component Segment 2019 - 2023 ($ million)
- Exhibits29: Historic Market Size - Type Segment 2019 - 2023 ($ million)
- Exhibits30: Historic Market Size - Technology Segment 2019 - 2023 ($ million)
- Exhibits31: Historic Market Size - Geography Segment 2019 - 2023 ($ million)
- Exhibits32: Historic Market Size - Country Segment 2019 - 2023 ($ million)
- Exhibits33: Five forces analysis - Comparison between 2024 and 2029
- Exhibits34: Bargaining power of buyers - Impact of key factors 2024 and 2029
- Exhibits35: Bargaining power of suppliers - Impact of key factors in 2024 and 2029
- Exhibits36: Threat of new entrants - Impact of key factors in 2024 and 2029
- Exhibits37: Threat of substitutes - Impact of key factors in 2024 and 2029
- Exhibits38: Threat of rivalry - Impact of key factors in 2024 and 2029
- Exhibits39: Chart on Market condition - Five forces 2024 and 2029
- Exhibits40: Chart on End-user - Market share 2024-2029 (%)
- Exhibits41: Data Table on End-user - Market share 2024-2029 (%)
- Exhibits42: Chart on Comparison by End-user
- Exhibits43: Data Table on Comparison by End-user
- Exhibits44: Chart on Law enforcement agencies - Market size and forecast 2024-2029 ($ million)
- Exhibits45: Data Table on Law enforcement agencies - Market size and forecast 2024-2029 ($ million)
- Exhibits46: Chart on Law enforcement agencies - Year-over-year growth 2024-2029 (%)
- Exhibits47: Data Table on Law enforcement agencies - Year-over-year growth 2024-2029 (%)
- Exhibits48: Chart on Enterprises - Market size and forecast 2024-2029 ($ million)
- Exhibits49: Data Table on Enterprises - Market size and forecast 2024-2029 ($ million)
- Exhibits50: Chart on Enterprises - Year-over-year growth 2024-2029 (%)
- Exhibits51: Data Table on Enterprises - Year-over-year growth 2024-2029 (%)
- Exhibits52: Market opportunity by End-user ($ million)
- Exhibits53: Data Table on Market opportunity by End-user ($ million)
- Exhibits54: Chart on Component - Market share 2024-2029 (%)
- Exhibits55: Data Table on Component - Market share 2024-2029 (%)
- Exhibits56: Chart on Comparison by Component
- Exhibits57: Data Table on Comparison by Component
- Exhibits58: Chart on Solutions - Market size and forecast 2024-2029 ($ million)
- Exhibits59: Data Table on Solutions - Market size and forecast 2024-2029 ($ million)
- Exhibits60: Chart on Solutions - Year-over-year growth 2024-2029 (%)
- Exhibits61: Data Table on Solutions - Year-over-year growth 2024-2029 (%)
- Exhibits62: Chart on Services - Market size and forecast 2024-2029 ($ million)
- Exhibits63: Data Table on Services - Market size and forecast 2024-2029 ($ million)
- Exhibits64: Chart on Services - Year-over-year growth 2024-2029 (%)
- Exhibits65: Data Table on Services - Year-over-year growth 2024-2029 (%)
- Exhibits66: Market opportunity by Component ($ million)
- Exhibits67: Data Table on Market opportunity by Component ($ million)
- Exhibits68: Chart on Type - Market share 2024-2029 (%)
- Exhibits69: Data Table on Type - Market share 2024-2029 (%)
- Exhibits70: Chart on Comparison by Type
- Exhibits71: Data Table on Comparison by Type
- Exhibits72: Chart on Voice communication - Market size and forecast 2024-2029 ($ million)
- Exhibits73: Data Table on Voice communication - Market size and forecast 2024-2029 ($ million)
- Exhibits74: Chart on Voice communication - Year-over-year growth 2024-2029 (%)
- Exhibits75: Data Table on Voice communication - Year-over-year growth 2024-2029 (%)
- Exhibits76: Chart on Data communication - Market size and forecast 2024-2029 ($ million)
- Exhibits77: Data Table on Data communication - Market size and forecast 2024-2029 ($ million)
- Exhibits78: Chart on Data communication - Year-over-year growth 2024-2029 (%)
- Exhibits79: Data Table on Data communication - Year-over-year growth 2024-2029 (%)
- Exhibits80: Chart on Messaging services - Market size and forecast 2024-2029 ($ million)
- Exhibits81: Data Table on Messaging services - Market size and forecast 2024-2029 ($ million)
- Exhibits82: Chart on Messaging services - Year-over-year growth 2024-2029 (%)
- Exhibits83: Data Table on Messaging services - Year-over-year growth 2024-2029 (%)
- Exhibits84: Chart on Social media and cloud-based communication - Market size and forecast 2024-2029 ($ million)
- Exhibits85: Data Table on Social media and cloud-based communication - Market size and forecast 2024-2029 ($ million)
- Exhibits86: Chart on Social media and cloud-based communication - Year-over-year growth 2024-2029 (%)
- Exhibits87: Data Table on Social media and cloud-based communication - Year-over-year growth 2024-2029 (%)
- Exhibits88: Market opportunity by Type ($ million)
- Exhibits89: Data Table on Market opportunity by Type ($ million)
- Exhibits90: Chart on Technology - Market share 2024-2029 (%)
- Exhibits91: Data Table on Technology - Market share 2024-2029 (%)
- Exhibits92: Chart on Comparison by Technology
- Exhibits93: Data Table on Comparison by Technology
- Exhibits94: Chart on Wireless networks - Market size and forecast 2024-2029 ($ million)
- Exhibits95: Data Table on Wireless networks - Market size and forecast 2024-2029 ($ million)
- Exhibits96: Chart on Wireless networks - Year-over-year growth 2024-2029 (%)
- Exhibits97: Data Table on Wireless networks - Year-over-year growth 2024-2029 (%)
- Exhibits98: Chart on Broadband networks - Market size and forecast 2024-2029 ($ million)
- Exhibits99: Data Table on Broadband networks - Market size and forecast 2024-2029 ($ million)
- Exhibits100: Chart on Broadband networks - Year-over-year growth 2024-2029 (%)
- Exhibits101: Data Table on Broadband networks - Year-over-year growth 2024-2029 (%)
- Exhibits102: Chart on 5G networks - Market size and forecast 2024-2029 ($ million)
- Exhibits103: Data Table on 5G networks - Market size and forecast 2024-2029 ($ million)
- Exhibits104: Chart on 5G networks - Year-over-year growth 2024-2029 (%)
- Exhibits105: Data Table on 5G networks - Year-over-year growth 2024-2029 (%)
- Exhibits106: Chart on Long-term evolution (LTE) - Market size and forecast 2024-2029 ($ million)
- Exhibits107: Data Table on Long-term evolution (LTE) - Market size and forecast 2024-2029 ($ million)
- Exhibits108: Chart on Long-term evolution (LTE) - Year-over-year growth 2024-2029 (%)
- Exhibits109: Data Table on Long-term evolution (LTE) - Year-over-year growth 2024-2029 (%)
- Exhibits110: Chart on Voice over internet protocol (VoIP) - Market size and forecast 2024-2029 ($ million)
- Exhibits111: Data Table on Voice over internet protocol (VoIP) - Market size and forecast 2024-2029 ($ million)
- Exhibits112: Chart on Voice over internet protocol (VoIP) - Year-over-year growth 2024-2029 (%)
- Exhibits113: Data Table on Voice over internet protocol (VoIP) - Year-over-year growth 2024-2029 (%)
- Exhibits114: Market opportunity by Technology ($ million)
- Exhibits115: Data Table on Market opportunity by Technology ($ million)
- Exhibits116: Analysis of price sensitivity, lifecycle, customer purchase basket, adoption rates, and purchase criteria
- Exhibits117: Chart on Market share By Geographical Landscape 2024-2029 (%)
- Exhibits118: Data Table on Market share By Geographical Landscape 2024-2029 (%)
- Exhibits119: Chart on Geographic comparison
- Exhibits120: Data Table on Geographic comparison
- Exhibits121: Chart on North America - Market size and forecast 2024-2029 ($ million)
- Exhibits122: Data Table on North America - Market size and forecast 2024-2029 ($ million)
- Exhibits123: Chart on North America - Year-over-year growth 2024-2029 (%)
- Exhibits124: Data Table on North America - Year-over-year growth 2024-2029 (%)
- Exhibits125: Chart on Europe - Market size and forecast 2024-2029 ($ million)
- Exhibits126: Data Table on Europe - Market size and forecast 2024-2029 ($ million)
- Exhibits127: Chart on Europe - Year-over-year growth 2024-2029 (%)
- Exhibits128: Data Table on Europe - Year-over-year growth 2024-2029 (%)
- Exhibits129: Chart on APAC - Market size and forecast 2024-2029 ($ million)
- Exhibits130: Data Table on APAC - Market size and forecast 2024-2029 ($ million)
- Exhibits131: Chart on APAC - Year-over-year growth 2024-2029 (%)
- Exhibits132: Data Table on APAC - Year-over-year growth 2024-2029 (%)
- Exhibits133: Chart on Middle East and Africa - Market size and forecast 2024-2029 ($ million)
- Exhibits134: Data Table on Middle East and Africa - Market size and forecast 2024-2029 ($ million)
- Exhibits135: Chart on Middle East and Africa - Year-over-year growth 2024-2029 (%)
- Exhibits136: Data Table on Middle East and Africa - Year-over-year growth 2024-2029 (%)
- Exhibits137: Chart on South America - Market size and forecast 2024-2029 ($ million)
- Exhibits138: Data Table on South America - Market size and forecast 2024-2029 ($ million)
- Exhibits139: Chart on South America - Year-over-year growth 2024-2029 (%)
- Exhibits140: Data Table on South America - Year-over-year growth 2024-2029 (%)
- Exhibits141: Chart on US - Market size and forecast 2024-2029 ($ million)
- Exhibits142: Data Table on US - Market size and forecast 2024-2029 ($ million)
- Exhibits143: Chart on US - Year-over-year growth 2024-2029 (%)
- Exhibits144: Data Table on US - Year-over-year growth 2024-2029 (%)
- Exhibits145: Chart on Germany - Market size and forecast 2024-2029 ($ million)
- Exhibits146: Data Table on Germany - Market size and forecast 2024-2029 ($ million)
- Exhibits147: Chart on Germany - Year-over-year growth 2024-2029 (%)
- Exhibits148: Data Table on Germany - Year-over-year growth 2024-2029 (%)
- Exhibits149: Chart on China - Market size and forecast 2024-2029 ($ million)
- Exhibits150: Data Table on China - Market size and forecast 2024-2029 ($ million)
- Exhibits151: Chart on China - Year-over-year growth 2024-2029 (%)
- Exhibits152: Data Table on China - Year-over-year growth 2024-2029 (%)
- Exhibits153: Chart on Canada - Market size and forecast 2024-2029 ($ million)
- Exhibits154: Data Table on Canada - Market size and forecast 2024-2029 ($ million)
- Exhibits155: Chart on Canada - Year-over-year growth 2024-2029 (%)
- Exhibits156: Data Table on Canada - Year-over-year growth 2024-2029 (%)
- Exhibits157: Chart on Japan - Market size and forecast 2024-2029 ($ million)
- Exhibits158: Data Table on Japan - Market size and forecast 2024-2029 ($ million)
- Exhibits159: Chart on Japan - Year-over-year growth 2024-2029 (%)
- Exhibits160: Data Table on Japan - Year-over-year growth 2024-2029 (%)
- Exhibits161: Chart on UK - Market size and forecast 2024-2029 ($ million)
- Exhibits162: Data Table on UK - Market size and forecast 2024-2029 ($ million)
- Exhibits163: Chart on UK - Year-over-year growth 2024-2029 (%)
- Exhibits164: Data Table on UK - Year-over-year growth 2024-2029 (%)
- Exhibits165: Chart on France - Market size and forecast 2024-2029 ($ million)
- Exhibits166: Data Table on France - Market size and forecast 2024-2029 ($ million)
- Exhibits167: Chart on France - Year-over-year growth 2024-2029 (%)
- Exhibits168: Data Table on France - Year-over-year growth 2024-2029 (%)
- Exhibits169: Chart on India - Market size and forecast 2024-2029 ($ million)
- Exhibits170: Data Table on India - Market size and forecast 2024-2029 ($ million)
- Exhibits171: Chart on India - Year-over-year growth 2024-2029 (%)
- Exhibits172: Data Table on India - Year-over-year growth 2024-2029 (%)
- Exhibits173: Chart on Italy - Market size and forecast 2024-2029 ($ million)
- Exhibits174: Data Table on Italy - Market size and forecast 2024-2029 ($ million)
- Exhibits175: Chart on Italy - Year-over-year growth 2024-2029 (%)
- Exhibits176: Data Table on Italy - Year-over-year growth 2024-2029 (%)
- Exhibits177: Chart on The Netherlands - Market size and forecast 2024-2029 ($ million)
- Exhibits178: Data Table on The Netherlands - Market size and forecast 2024-2029 ($ million)
- Exhibits179: Chart on The Netherlands - Year-over-year growth 2024-2029 (%)
- Exhibits180: Data Table on The Netherlands - Year-over-year growth 2024-2029 (%)
- Exhibits181: Market opportunity By Geographical Landscape ($ million)
- Exhibits182: Data Tables on Market opportunity By Geographical Landscape ($ million)
- Exhibits183: Impact of drivers and challenges in 2024 and 2029
- Exhibits184: Overview on criticality of inputs and factors of differentiation
- Exhibits185: Overview on factors of disruption
- Exhibits186: Impact of key risks on business
- Exhibits187: Companies covered
- Exhibits188: Company ranking index
- Exhibits189: Matrix on companies position and classification
- Exhibits190: AQSACOM Inc. - Overview
- Exhibits191: AQSACOM Inc. - Product / Service
- Exhibits192: AQSACOM Inc. - Key offerings
- Exhibits193: SWOT
- Exhibits194: BAE Systems Plc - Overview
- Exhibits195: BAE Systems Plc - Business segments
- Exhibits196: BAE Systems Plc - Key news
- Exhibits197: BAE Systems Plc - Key offerings
- Exhibits198: BAE Systems Plc - Segment focus
- Exhibits199: SWOT
- Exhibits200: Cisco Systems Inc. - Overview
- Exhibits201: Cisco Systems Inc. - Business segments
- Exhibits202: Cisco Systems Inc. - Key news
- Exhibits203: Cisco Systems Inc. - Key offerings
- Exhibits204: Cisco Systems Inc. - Segment focus
- Exhibits205: SWOT
- Exhibits206: Dreamlab Technologies AG - Overview
- Exhibits207: Dreamlab Technologies AG - Product / Service
- Exhibits208: Dreamlab Technologies AG - Key offerings
- Exhibits209: SWOT
- Exhibits210: Incognito Software Systems Inc. - Overview
- Exhibits211: Incognito Software Systems Inc. - Product / Service
- Exhibits212: Incognito Software Systems Inc. - Key offerings
- Exhibits213: SWOT
- Exhibits214: IPS Intelligence and Public Security Spa - Overview
- Exhibits215: IPS Intelligence and Public Security Spa - Product / Service
- Exhibits216: IPS Intelligence and Public Security Spa - Key offerings
- Exhibits217: SWOT
- Exhibits218: Keysight Technologies Inc. - Overview
- Exhibits219: Keysight Technologies Inc. - Business segments
- Exhibits220: Keysight Technologies Inc. - Key news
- Exhibits221: Keysight Technologies Inc. - Key offerings
- Exhibits222: Keysight Technologies Inc. - Segment focus
- Exhibits223: SWOT
- Exhibits224: Musarubra US LLC - Overview
- Exhibits225: Musarubra US LLC - Product / Service
- Exhibits226: Musarubra US LLC - Key news
- Exhibits227: Musarubra US LLC - Key offerings
- Exhibits228: SWOT
- Exhibits229: Pert Telecom Solutions Pvt. Ltd. - Overview
- Exhibits230: Pert Telecom Solutions Pvt. Ltd. - Product / Service
- Exhibits231: Pert Telecom Solutions Pvt. Ltd. - Key offerings
- Exhibits232: SWOT
- Exhibits233: Progress Software Corp. - Overview
- Exhibits234: Progress Software Corp. - Product / Service
- Exhibits235: Progress Software Corp. - Key offerings
- Exhibits236: SWOT
- Exhibits237: SS8 Networks Inc. - Overview
- Exhibits238: SS8 Networks Inc. - Product / Service
- Exhibits239: SS8 Networks Inc. - Key offerings
- Exhibits240: SWOT
- Exhibits241: Telefonaktiebolaget LM Ericsson - Overview
- Exhibits242: Telefonaktiebolaget LM Ericsson - Business segments
- Exhibits243: Telefonaktiebolaget LM Ericsson - Key news
- Exhibits244: Telefonaktiebolaget LM Ericsson - Key offerings
- Exhibits245: Telefonaktiebolaget LM Ericsson - Segment focus
- Exhibits246: SWOT
- Exhibits247: Utimaco GmbH - Overview
- Exhibits248: Utimaco GmbH - Product / Service
- Exhibits249: Utimaco GmbH - Key offerings
- Exhibits250: SWOT
- Exhibits251: Verint Systems Inc. - Overview
- Exhibits252: Verint Systems Inc. - Product / Service
- Exhibits253: Verint Systems Inc. - Key offerings
- Exhibits254: SWOT
- Exhibits255: ZTE Corp. - Overview
- Exhibits256: ZTE Corp. - Business segments
- Exhibits257: ZTE Corp. - Key offerings
- Exhibits258: ZTE Corp. - Segment focus
- Exhibits259: SWOT
- Exhibits260: Inclusions checklist
- Exhibits261: Exclusions checklist
- Exhibits262: Currency conversion rates for US$
- Exhibits263: Research methodology
- Exhibits264: Information sources
- Exhibits265: Data validation
- Exhibits266: Validation techniques employed for market sizing
- Exhibits267: Data synthesis
- Exhibits268: 360 degree market analysis
- Exhibits269: List of abbreviations
The lawful interception (LI) market is forecasted to grow by USD 22238.8 mn during 2024-2029, accelerating at a CAGR of 36.9% during the forecast period. The report on the lawful interception (LI) market provides a holistic analysis, market size and forecast, trends, growth drivers, and challenges, as well as vendor analysis covering around 25 vendors.
The report offers an up-to-date analysis regarding the current market scenario, the latest trends and drivers, and the overall market environment. The market is driven by increasing vulnerability to crime and terrorism, company compliance with standards and regulations governing lawful interception, and rise in volume of data traffic and security threats.
| Market Scope | |
|---|---|
| Base Year | 2025 |
| End Year | 2029 |
| Series Year | 2025-2029 |
| Growth Momentum | Accelerate |
| YOY 2025 | 28.6% |
| CAGR | 36.9% |
| Incremental Value | $22238.8 mn |
The study was conducted using an objective combination of primary and secondary information including inputs from key participants in the industry. The report contains a comprehensive market size data, segment with regional analysis and vendor landscape in addition to an analysis of the key companies. Reports have historic and forecast data.
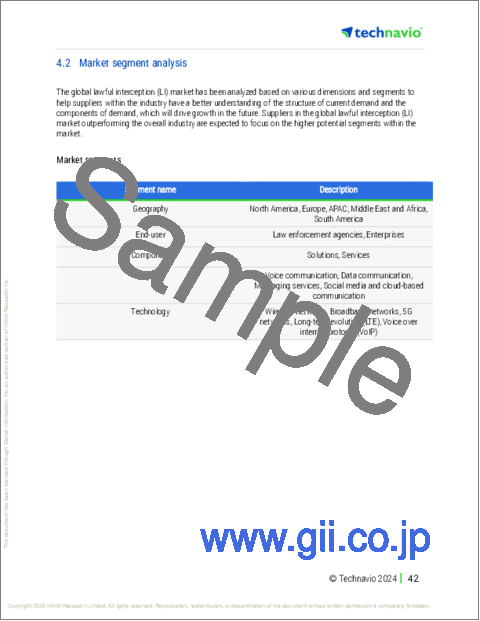
Technavio's lawful interception (LI) market is segmented as below:
By End-user
- Law enforcement agencies
- Enterprises
By Component
- Solutions
- Services
By Type
- Voice communication
- Data communication
- Messaging services
- Social media and cloud-based communication
By Technology
- Wireless networks
- Broadband networks
- 5G networks
- Long-term evolution (LTE)
- Voice over internet protocol (VoIP)
By Geographical Landscape
- North America
- Europe
- APAC
- Middle East and Africa
- South America
This study identifies the recent developments by companies of lawful interception solutions as one of the prime reasons driving the lawful interception (LI) market growth during the next few years. Also, growing popularity of virtualized lawful interception and rising use of lte networks will lead to sizable demand in the market.
The report on the lawful interception (LI) market covers the following areas:
- Lawful Interception (LI) Market sizing
- Lawful Interception (LI) Market forecast
- Lawful Interception (LI) Market industry analysis
The robust vendor analysis is designed to help clients improve their market position, and in line with this, this report provides a detailed analysis of several leading lawful interception (LI) market vendors that include AQSACOM Inc., BAE Systems Plc, Cisco Systems Inc., Dreamlab Technologies AG, Incognito Software Systems Inc., IPS Intelligence and Public Security Spa, Keysight Technologies Inc., Musarubra US LLC, Pert Telecom Solutions Pvt. Ltd., Progress Software Corp., RCS ETM SICUREZZA Spa, Signalogic Inc., SIO Spa, SS8 Networks Inc., SSI PACIFIC PTY LTD., TelcoBridges Inc., Telefonaktiebolaget LM Ericsson, Utimaco GmbH, Verint Systems Inc., and ZTE Corp.. Also, the lawful interception (LI) market analysis report includes information on upcoming trends and challenges that will influence market growth. This is to help companies strategize and leverage all forthcoming growth opportunities.
The publisher presents a detailed picture of the market by the way of study, synthesis, and summation of data from multiple sources by an analysis of key parameters such as profit, pricing, competition, and promotions. It presents various market facets by identifying the key industry influencers. The data presented is comprehensive, reliable, and a result of extensive primary and secondary research. The market research reports provide a complete competitive landscape and an in-depth vendor selection methodology and analysis using qualitative and quantitative research to forecast accurate market growth.
Table of Contents
1 Executive Summary
- 1.1 Market overview
- Executive Summary - Chart on Market Overview
- Executive Summary - Data Table on Market Overview
- Executive Summary - Chart on Global Market Characteristics
- Executive Summary - Chart on Market By Geographical Landscape
- Executive Summary - Chart on Market Segmentation by End-user
- Executive Summary - Chart on Market Segmentation by Component
- Executive Summary - Chart on Market Segmentation by Type
- Executive Summary - Chart on Market Segmentation by Technology
- Executive Summary - Chart on Incremental Growth
- Executive Summary - Data Table on Incremental Growth
- Executive Summary - Chart on Company Market Positioning
2 Technavio Analysis
- 2.1 Analysis of price sensitivity, lifecycle, customer purchase basket, adoption rates, and purchase criteria
- Analysis of price sensitivity, lifecycle, customer purchase basket, adoption rates, and purchase criteria
- 2.2 Criticality of inputs and Factors of differentiation
- Overview on criticality of inputs and factors of differentiation
- 2.3 Factors of disruption
- Overview on factors of disruption
- 2.4 Impact of drivers and challenges
- Impact of drivers and challenges in 2024 and 2029
3 Market Landscape
- 3.1 Market ecosystem
- Parent Market
- Data Table on - Parent Market
- 3.2 Market characteristics
- Market characteristics analysis
- 3.3 Value chain analysis
- Value chain analysis
4 Market Sizing
- 4.1 Market definition
- Offerings of companies included in the market definition
- 4.2 Market segment analysis
- Market segments
- 4.3 Market size 2024
- 4.4 Market outlook: Forecast for 2024-2029
- Chart on Global - Market size and forecast 2024-2029 ($ million)
- Data Table on Global - Market size and forecast 2024-2029 ($ million)
- Chart on Global Market: Year-over-year growth 2024-2029 (%)
- Data Table on Global Market: Year-over-year growth 2024-2029 (%)
5 Historic Market Size
- 5.1 Global Lawful Interception (LI) Market 2019 - 2023
- Historic Market Size - Data Table on Global Lawful Interception (LI) Market 2019 - 2023 ($ million)
- 5.2 End-user segment analysis 2019 - 2023
- Historic Market Size - End-user Segment 2019 - 2023 ($ million)
- 5.3 Component segment analysis 2019 - 2023
- Historic Market Size - Component Segment 2019 - 2023 ($ million)
- 5.4 Type segment analysis 2019 - 2023
- Historic Market Size - Type Segment 2019 - 2023 ($ million)
- 5.5 Technology segment analysis 2019 - 2023
- Historic Market Size - Technology Segment 2019 - 2023 ($ million)
- 5.6 Geography segment analysis 2019 - 2023
- Historic Market Size - Geography Segment 2019 - 2023 ($ million)
- 5.7 Country segment analysis 2019 - 2023
- Historic Market Size - Country Segment 2019 - 2023 ($ million)
6 Qualitative Analysis
- 6.1 Impact of AI on Global Lawful Interception (LI) Market
7 Five Forces Analysis
- 7.1 Five forces summary
- Five forces analysis - Comparison between 2024 and 2029
- 7.2 Bargaining power of buyers
- Bargaining power of buyers - Impact of key factors 2024 and 2029
- 7.3 Bargaining power of suppliers
- Bargaining power of suppliers - Impact of key factors in 2024 and 2029
- 7.4 Threat of new entrants
- Threat of new entrants - Impact of key factors in 2024 and 2029
- 7.5 Threat of substitutes
- Threat of substitutes - Impact of key factors in 2024 and 2029
- 7.6 Threat of rivalry
- Threat of rivalry - Impact of key factors in 2024 and 2029
- 7.7 Market condition
- Chart on Market condition - Five forces 2024 and 2029
8 Market Segmentation by End-user
- 8.1 Market segments
- Chart on End-user - Market share 2024-2029 (%)
- Data Table on End-user - Market share 2024-2029 (%)
- 8.2 Comparison by End-user
- Chart on Comparison by End-user
- Data Table on Comparison by End-user
- 8.3 Law enforcement agencies - Market size and forecast 2024-2029
- Chart on Law enforcement agencies - Market size and forecast 2024-2029 ($ million)
- Data Table on Law enforcement agencies - Market size and forecast 2024-2029 ($ million)
- Chart on Law enforcement agencies - Year-over-year growth 2024-2029 (%)
- Data Table on Law enforcement agencies - Year-over-year growth 2024-2029 (%)
- 8.4 Enterprises - Market size and forecast 2024-2029
- Chart on Enterprises - Market size and forecast 2024-2029 ($ million)
- Data Table on Enterprises - Market size and forecast 2024-2029 ($ million)
- Chart on Enterprises - Year-over-year growth 2024-2029 (%)
- Data Table on Enterprises - Year-over-year growth 2024-2029 (%)
- 8.5 Market opportunity by End-user
- Market opportunity by End-user ($ million)
- Data Table on Market opportunity by End-user ($ million)
9 Market Segmentation by Component
- 9.1 Market segments
- Chart on Component - Market share 2024-2029 (%)
- Data Table on Component - Market share 2024-2029 (%)
- 9.2 Comparison by Component
- Chart on Comparison by Component
- Data Table on Comparison by Component
- 9.3 Solutions - Market size and forecast 2024-2029
- Chart on Solutions - Market size and forecast 2024-2029 ($ million)
- Data Table on Solutions - Market size and forecast 2024-2029 ($ million)
- Chart on Solutions - Year-over-year growth 2024-2029 (%)
- Data Table on Solutions - Year-over-year growth 2024-2029 (%)
- 9.4 Services - Market size and forecast 2024-2029
- Chart on Services - Market size and forecast 2024-2029 ($ million)
- Data Table on Services - Market size and forecast 2024-2029 ($ million)
- Chart on Services - Year-over-year growth 2024-2029 (%)
- Data Table on Services - Year-over-year growth 2024-2029 (%)
- 9.5 Market opportunity by Component
- Market opportunity by Component ($ million)
- Data Table on Market opportunity by Component ($ million)
10 Market Segmentation by Type
- 10.1 Market segments
- Chart on Type - Market share 2024-2029 (%)
- Data Table on Type - Market share 2024-2029 (%)
- 10.2 Comparison by Type
- Chart on Comparison by Type
- Data Table on Comparison by Type
- 10.3 Voice communication - Market size and forecast 2024-2029
- Chart on Voice communication - Market size and forecast 2024-2029 ($ million)
- Data Table on Voice communication - Market size and forecast 2024-2029 ($ million)
- Chart on Voice communication - Year-over-year growth 2024-2029 (%)
- Data Table on Voice communication - Year-over-year growth 2024-2029 (%)
- 10.4 Data communication - Market size and forecast 2024-2029
- Chart on Data communication - Market size and forecast 2024-2029 ($ million)
- Data Table on Data communication - Market size and forecast 2024-2029 ($ million)
- Chart on Data communication - Year-over-year growth 2024-2029 (%)
- Data Table on Data communication - Year-over-year growth 2024-2029 (%)
- 10.5 Messaging services - Market size and forecast 2024-2029
- Chart on Messaging services - Market size and forecast 2024-2029 ($ million)
- Data Table on Messaging services - Market size and forecast 2024-2029 ($ million)
- Chart on Messaging services - Year-over-year growth 2024-2029 (%)
- Data Table on Messaging services - Year-over-year growth 2024-2029 (%)
- 10.6 Social media and cloud-based communication - Market size and forecast 2024-2029
- Chart on Social media and cloud-based communication - Market size and forecast 2024-2029 ($ million)
- Data Table on Social media and cloud-based communication - Market size and forecast 2024-2029 ($ million)
- Chart on Social media and cloud-based communication - Year-over-year growth 2024-2029 (%)
- Data Table on Social media and cloud-based communication - Year-over-year growth 2024-2029 (%)
- 10.7 Market opportunity by Type
- Market opportunity by Type ($ million)
- Data Table on Market opportunity by Type ($ million)
11 Market Segmentation by Technology
- 11.1 Market segments
- Chart on Technology - Market share 2024-2029 (%)
- Data Table on Technology - Market share 2024-2029 (%)
- 11.2 Comparison by Technology
- Chart on Comparison by Technology
- Data Table on Comparison by Technology
- 11.3 Wireless networks - Market size and forecast 2024-2029
- Chart on Wireless networks - Market size and forecast 2024-2029 ($ million)
- Data Table on Wireless networks - Market size and forecast 2024-2029 ($ million)
- Chart on Wireless networks - Year-over-year growth 2024-2029 (%)
- Data Table on Wireless networks - Year-over-year growth 2024-2029 (%)
- 11.4 Broadband networks - Market size and forecast 2024-2029
- Chart on Broadband networks - Market size and forecast 2024-2029 ($ million)
- Data Table on Broadband networks - Market size and forecast 2024-2029 ($ million)
- Chart on Broadband networks - Year-over-year growth 2024-2029 (%)
- Data Table on Broadband networks - Year-over-year growth 2024-2029 (%)
- 5G networks - Market size and forecast 2024-2029
- Chart on 5G networks - Market size and forecast 2024-2029 ($ million)
- Data Table on 5G networks - Market size and forecast 2024-2029 ($ million)
- Chart on 5G networks - Year-over-year growth 2024-2029 (%)
- Data Table on 5G networks - Year-over-year growth 2024-2029 (%)
- 11.6 Long-term evolution (LTE) - Market size and forecast 2024-2029
- Chart on Long-term evolution (LTE) - Market size and forecast 2024-2029 ($ million)
- Data Table on Long-term evolution (LTE) - Market size and forecast 2024-2029 ($ million)
- Chart on Long-term evolution (LTE) - Year-over-year growth 2024-2029 (%)
- Data Table on Long-term evolution (LTE) - Year-over-year growth 2024-2029 (%)
- 11.7 Voice over internet protocol (VoIP) - Market size and forecast 2024-2029
- Chart on Voice over internet protocol (VoIP) - Market size and forecast 2024-2029 ($ million)
- Data Table on Voice over internet protocol (VoIP) - Market size and forecast 2024-2029 ($ million)
- Chart on Voice over internet protocol (VoIP) - Year-over-year growth 2024-2029 (%)
- Data Table on Voice over internet protocol (VoIP) - Year-over-year growth 2024-2029 (%)
- 11.8 Market opportunity by Technology
- Market opportunity by Technology ($ million)
- Data Table on Market opportunity by Technology ($ million)
12 Customer Landscape
- 12.1 Customer landscape overview
- Analysis of price sensitivity, lifecycle, customer purchase basket, adoption rates, and purchase criteria
13 Geographic Landscape
- 13.1 Geographic segmentation
- Chart on Market share By Geographical Landscape 2024-2029 (%)
- Data Table on Market share By Geographical Landscape 2024-2029 (%)
- 13.2 Geographic comparison
- Chart on Geographic comparison
- Data Table on Geographic comparison
- 13.3 North America - Market size and forecast 2024-2029
- Chart on North America - Market size and forecast 2024-2029 ($ million)
- Data Table on North America - Market size and forecast 2024-2029 ($ million)
- Chart on North America - Year-over-year growth 2024-2029 (%)
- Data Table on North America - Year-over-year growth 2024-2029 (%)
- 13.4 Europe - Market size and forecast 2024-2029
- Chart on Europe - Market size and forecast 2024-2029 ($ million)
- Data Table on Europe - Market size and forecast 2024-2029 ($ million)
- Chart on Europe - Year-over-year growth 2024-2029 (%)
- Data Table on Europe - Year-over-year growth 2024-2029 (%)
- 13.5 APAC - Market size and forecast 2024-2029
- Chart on APAC - Market size and forecast 2024-2029 ($ million)
- Data Table on APAC - Market size and forecast 2024-2029 ($ million)
- Chart on APAC - Year-over-year growth 2024-2029 (%)
- Data Table on APAC - Year-over-year growth 2024-2029 (%)
- 13.6 Middle East and Africa - Market size and forecast 2024-2029
- Chart on Middle East and Africa - Market size and forecast 2024-2029 ($ million)
- Data Table on Middle East and Africa - Market size and forecast 2024-2029 ($ million)
- Chart on Middle East and Africa - Year-over-year growth 2024-2029 (%)
- Data Table on Middle East and Africa - Year-over-year growth 2024-2029 (%)
- 13.7 South America - Market size and forecast 2024-2029
- Chart on South America - Market size and forecast 2024-2029 ($ million)
- Data Table on South America - Market size and forecast 2024-2029 ($ million)
- Chart on South America - Year-over-year growth 2024-2029 (%)
- Data Table on South America - Year-over-year growth 2024-2029 (%)
- 13.8 US - Market size and forecast 2024-2029
- Chart on US - Market size and forecast 2024-2029 ($ million)
- Data Table on US - Market size and forecast 2024-2029 ($ million)
- Chart on US - Year-over-year growth 2024-2029 (%)
- Data Table on US - Year-over-year growth 2024-2029 (%)
- 13.9 Germany - Market size and forecast 2024-2029
- Chart on Germany - Market size and forecast 2024-2029 ($ million)
- Data Table on Germany - Market size and forecast 2024-2029 ($ million)
- Chart on Germany - Year-over-year growth 2024-2029 (%)
- Data Table on Germany - Year-over-year growth 2024-2029 (%)
- 13.10 China - Market size and forecast 2024-2029
- Chart on China - Market size and forecast 2024-2029 ($ million)
- Data Table on China - Market size and forecast 2024-2029 ($ million)
- Chart on China - Year-over-year growth 2024-2029 (%)
- Data Table on China - Year-over-year growth 2024-2029 (%)
- 13.11 Canada - Market size and forecast 2024-2029
- Chart on Canada - Market size and forecast 2024-2029 ($ million)
- Data Table on Canada - Market size and forecast 2024-2029 ($ million)
- Chart on Canada - Year-over-year growth 2024-2029 (%)
- Data Table on Canada - Year-over-year growth 2024-2029 (%)
- 13.12 Japan - Market size and forecast 2024-2029
- Chart on Japan - Market size and forecast 2024-2029 ($ million)
- Data Table on Japan - Market size and forecast 2024-2029 ($ million)
- Chart on Japan - Year-over-year growth 2024-2029 (%)
- Data Table on Japan - Year-over-year growth 2024-2029 (%)
- 13.13 UK - Market size and forecast 2024-2029
- Chart on UK - Market size and forecast 2024-2029 ($ million)
- Data Table on UK - Market size and forecast 2024-2029 ($ million)
- Chart on UK - Year-over-year growth 2024-2029 (%)
- Data Table on UK - Year-over-year growth 2024-2029 (%)
- 13.14 France - Market size and forecast 2024-2029
- Chart on France - Market size and forecast 2024-2029 ($ million)
- Data Table on France - Market size and forecast 2024-2029 ($ million)
- Chart on France - Year-over-year growth 2024-2029 (%)
- Data Table on France - Year-over-year growth 2024-2029 (%)
- 13.15 India - Market size and forecast 2024-2029
- Chart on India - Market size and forecast 2024-2029 ($ million)
- Data Table on India - Market size and forecast 2024-2029 ($ million)
- Chart on India - Year-over-year growth 2024-2029 (%)
- Data Table on India - Year-over-year growth 2024-2029 (%)
- 13.16 Italy - Market size and forecast 2024-2029
- Chart on Italy - Market size and forecast 2024-2029 ($ million)
- Data Table on Italy - Market size and forecast 2024-2029 ($ million)
- Chart on Italy - Year-over-year growth 2024-2029 (%)
- Data Table on Italy - Year-over-year growth 2024-2029 (%)
- 13.17 The Netherlands - Market size and forecast 2024-2029
- Chart on The Netherlands - Market size and forecast 2024-2029 ($ million)
- Data Table on The Netherlands - Market size and forecast 2024-2029 ($ million)
- Chart on The Netherlands - Year-over-year growth 2024-2029 (%)
- Data Table on The Netherlands - Year-over-year growth 2024-2029 (%)
- 13.18 Market opportunity By Geographical Landscape
- Market opportunity By Geographical Landscape ($ million)
- Data Tables on Market opportunity By Geographical Landscape ($ million)
14 Drivers, Challenges, and Opportunity/Restraints
- 14.1 Market drivers
- 14.2 Market challenges
- 14.3 Impact of drivers and challenges
- Impact of drivers and challenges in 2024 and 2029
- 14.4 Market opportunities/restraints
15 Competitive Landscape
- 15.1 Overview
- 15.2 Competitive Landscape
- Overview on criticality of inputs and factors of differentiation
- 15.3 Landscape disruption
- Overview on factors of disruption
- 15.4 Industry risks
- Impact of key risks on business
16 Competitive Analysis
- 16.1 Companies profiled
- Companies covered
- 16.2 Company ranking index
- Company ranking index
- 16.3 Market positioning of companies
- Matrix on companies position and classification
- 16.4 AQSACOM Inc.
- AQSACOM Inc. - Overview
- AQSACOM Inc. - Product / Service
- AQSACOM Inc. - Key offerings
- SWOT
- 16.5 BAE Systems Plc
- BAE Systems Plc - Overview
- BAE Systems Plc - Business segments
- BAE Systems Plc - Key news
- BAE Systems Plc - Key offerings
- BAE Systems Plc - Segment focus
- SWOT
- 16.6 Cisco Systems Inc.
- Cisco Systems Inc. - Overview
- Cisco Systems Inc. - Business segments
- Cisco Systems Inc. - Key news
- Cisco Systems Inc. - Key offerings
- Cisco Systems Inc. - Segment focus
- SWOT
- 16.7 Dreamlab Technologies AG
- Dreamlab Technologies AG - Overview
- Dreamlab Technologies AG - Product / Service
- Dreamlab Technologies AG - Key offerings
- SWOT
- 16.8 Incognito Software Systems Inc.
- Incognito Software Systems Inc. - Overview
- Incognito Software Systems Inc. - Product / Service
- Incognito Software Systems Inc. - Key offerings
- SWOT
- 16.9 IPS Intelligence and Public Security Spa
- IPS Intelligence and Public Security Spa - Overview
- IPS Intelligence and Public Security Spa - Product / Service
- IPS Intelligence and Public Security Spa - Key offerings
- SWOT
- 16.10 Keysight Technologies Inc.
- Keysight Technologies Inc. - Overview
- Keysight Technologies Inc. - Business segments
- Keysight Technologies Inc. - Key news
- Keysight Technologies Inc. - Key offerings
- Keysight Technologies Inc. - Segment focus
- SWOT
- 16.11 Musarubra US LLC
- Musarubra US LLC - Overview
- Musarubra US LLC - Product / Service
- Musarubra US LLC - Key news
- Musarubra US LLC - Key offerings
- SWOT
- 16.12 Pert Telecom Solutions Pvt. Ltd.
- Pert Telecom Solutions Pvt. Ltd. - Overview
- Pert Telecom Solutions Pvt. Ltd. - Product / Service
- Pert Telecom Solutions Pvt. Ltd. - Key offerings
- SWOT
- 16.13 Progress Software Corp.
- Progress Software Corp. - Overview
- Progress Software Corp. - Product / Service
- Progress Software Corp. - Key offerings
- SWOT
- 16.14 SS8 Networks Inc.
- SS8 Networks Inc. - Overview
- SS8 Networks Inc. - Product / Service
- SS8 Networks Inc. - Key offerings
- SWOT
- 16.15 Telefonaktiebolaget LM Ericsson
- Telefonaktiebolaget LM Ericsson - Overview
- Telefonaktiebolaget LM Ericsson - Business segments
- Telefonaktiebolaget LM Ericsson - Key news
- Telefonaktiebolaget LM Ericsson - Key offerings
- Telefonaktiebolaget LM Ericsson - Segment focus
- SWOT
- 16.16 Utimaco GmbH
- Utimaco GmbH - Overview
- Utimaco GmbH - Product / Service
- Utimaco GmbH - Key offerings
- SWOT
- 16.17 Verint Systems Inc.
- Verint Systems Inc. - Overview
- Verint Systems Inc. - Product / Service
- Verint Systems Inc. - Key offerings
- SWOT
- 16.18 ZTE Corp.
- ZTE Corp. - Overview
- ZTE Corp. - Business segments
- ZTE Corp. - Key offerings
- ZTE Corp. - Segment focus
- SWOT
17 Appendix
- 17.1 Scope of the report
- 17.2 Inclusions and exclusions checklist
- Inclusions checklist
- Exclusions checklist
- 17.3 Currency conversion rates for US$
- Currency conversion rates for US$
- 17.4 Research methodology
- Research methodology
- 17.5 Data procurement
- Information sources
- 17.6 Data validation
- Data validation
- 17.7 Validation techniques employed for market sizing
- Validation techniques employed for market sizing
- 17.8 Data synthesis
- Data synthesis
- 17.9 360 degree market analysis
- 360 degree market analysis
- 17.10 List of abbreviations
- List of abbreviations