|
|
市場調査レポート
商品コード
1636632
通信ネットワーク事業者の市場レビュー (2024年第3四半期):トップラインは回復したが、継続的な支出削減により年換算CAPEXは3,000億米ドルの大台を割り込むTelecommunications Network Operators - 3Q24 Market Review: Telco Topline Rebounds but Annualized Capex Dips Below $300B Mark amid Continued Spending Cuts |
||||||
|
|||||||
|
|||||||


| 通信ネットワーク事業者の市場レビュー (2024年第3四半期):トップラインは回復したが、継続的な支出削減により年換算CAPEXは3,000億米ドルの大台を割り込む |
|
出版日: 2025年01月16日
発行: MTN Consulting, LLC
ページ情報: 英文
納期: 即納可能
|

全表示
- 概要
- 図表
- 目次
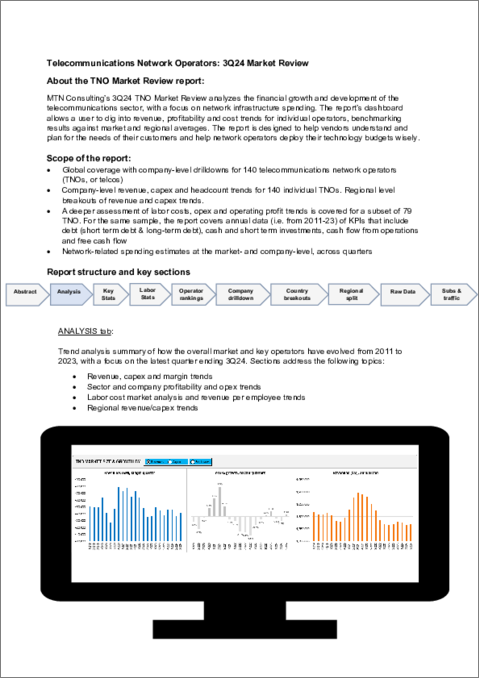
本レポートでは、通信ネットワーク事業者市場の成長と発展についてレビューしています。本レポートでは、2011年第1四半期から2024年第3四半期までの世界の通信事業者140社の財務統計を幅広く追跡調査しています。
通信ネットワーク事業者の2024年第3四半期の年率換算収益は1兆7,700億米ドル (前年同期比0.1%増)、人件費は2,624億米ドル (同0.8%増)、設備投資額は2,946億米ドル (同7.7%減) でした。2024年9月時点の従業員数は約445万人で、前年比1.5%減減となっています。
ビジュアル
レポートハイライト:
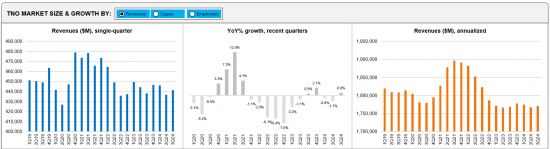
収益:通信業界のトップラインは前年同期比0.8%増の4,414億米ドル、2024年第3四半期の年率換算収益は前年同期比0.1%増の1兆7,706億米ドルとなっています。通信事業者レベルでは、2024年第3四半期のトップライン成長率上位20社のうち、年率換算でAirtel (4.6%)、America Movil (4.3%)、STC (Saudi Telecom) (4.2%)、Deutsche Telekom (3.3%)、BT (2.5%) の5社がランクインしました。同じ基準で、同期間に最も伸び率が悪かったのは、Vodafone (-6.8%)、KDDI (-5.7%)、NTT (-5.0%)、SoftBank (-3.6%)、BCE (-1.6%) でした。為替レートの変動は第3四半期の大きな要因ではなく、ほとんどの主要通貨は第3四半期の水準に対して比較的安定していました。
設備投資:2024年9月期の設備投資額は前年同期比6.1%減の711億米ドルであり、2024年第3四半期の設備投資額は年率換算で2,946億米ドルとなり、前年同期比で7.7%減少しました。事業者レベルでは、2024年第3四半期の年率換算設備投資の伸び率上位20社のうち5社は、BSNL (300.6%)、Telstra (52.3%)、BT (4.8%)、NTT (3.0%)、China Mobile (1.9%) でした。同じ基準で、同期間の設備投資の伸びが最も悪かったのは、Reliance Jio (27.4%減)、Verizon (22.5%減)、Vodafone (20.0%減)、Deutsche Telekom (18.1%減)、KDDI (16.3%減) でした。
OPEX・人件費:2024年第3四半期のOPEXは1兆5,079億米ドルで、前年同期比0.9%の微増でした。減価償却費を除くと、前年同期比1.7%増の1兆1,794億米ドルでした。通信事業者のOPEXの重要な要素のひとつは人件費であり、これには給与、賃金、賞与、福利厚生、退職金などが含まれます。2024年第3四半期の年率換算人件費は前年同期比0.8%増加し、OPEX (D&Aを除く) に占める人件費の割合は22.2%でした。
利益率:2024年第3四半期の年率換算EBITDAマージン、EBITマージンはともに2023年第3四半期と比較して若干の低下を示しました。年率換算EBITマージンは2023年第3四半期の15.5%から、2024年第3四半期は14.8%に低下し、2024年第3四半期の年率換算EBITDAマージンは33.4%となり、2023年第3四半期の34.5%から低下しました。
地域動向:南北アメリカは2024年第3四半期においても最大の収益地域の地位を維持し、世界の通信事業収入の37.2%を占め、アジアが36.4%で僅差で続いています。設備投資ベースでは、アジアが世界の設備投資の38.2%を占め、南北アメリカを上回ってトップとなっています。これは、南北アメリカがAT&TとVerizonの5G支出を背景に1位となった2022年第3四半期と2023年第3四半期からの変化です。年率換算の資本集約度は欧州が最も高く、2024年第3四半期では17.8%、次いで中東・アフリカが17.0%でした。
対象事業者
|
|
調査対象地域:
|
|
目次
- 1.レポートハイライト
- 2.サマリー
- 3.市場スナップショット
- 4.分析
- 5.主要統計:2024年第3四半期
- 6.従業員統計
- 7.オペレーターランキング
- 8.企業のドリルダウン
- 9.企業のベンチマーキング
- 10.国別内訳
- 11.企業・国別内訳
- 12.地域別内訳
- 13.生データ
- 14.加入者・トラフィック
- 15.為替レート
- 16.調査手法・範囲
- 17.当社について
List of Figures and Charts:
- 1. TNO market size & growth by: Revenues, Capex, Employees - 1Q19-3Q24
- 2. Regional trends by: Revenues, Capex - 1Q19-3Q24
- 3. Opex & Cost trends
- 4. Labor cost trends: 1Q20-3Q24
- 5. Profitability margin trends: 1Q20-3Q24
- 6. Spending (opex, labor costs, capex): annual and quarterly trend
- 7. Key ratios: annual and quarterly trend
- 8. Workforce & productivity trends: 1Q14-3Q24
- 9. Operator rankings by revenue and capex: latest single-quarter and annualized periods
- 10. Top 20 TNOs by capital intensity: latest single-quarter and annualized periods
- 11. Top 20 TNOs by employee base: latest single-quarter
- 12. TNOs: YoY growth in single quarter revenues
- 13. TNOs: Annualized capital intensity, 1Q16-3Q24
- 14. TNOs: Revenue and RPE, annualized 1Q16-3Q24
- 15. TNOs: Capex and capital intensity (annualized), 1Q16-3Q24
- 16. TNOs: Total headcount trends, 1Q16-2Q24
- 17. TNOs: Revenue and RPE trends, 2011-23
- 18. TNOs: Capex and capital intensity, 2011-23 ($ Mn)
- 19. TNOs: Capex and capital intensity, 1Q16-3Q24 ($ Mn)
- 20. TNOs: Revenue and RPE trends, 1Q16-3Q24
- 21. TNOs by total opex, 3Q24
- 22. TNOs by labor costs, 3Q24
- 23. TNOs: Software as % of total capex
- 24. TNOs: Software & spectrum spend
- 25. TNOs: Total M&A, spectrum and capex (excl. spectrum)
- 26. TNOs by total debt: 2011-23
- 27. TNOs by total net debt: 2011-23
- 28. TNOs by long term debt: 2011-23
- 29. TNOs by short term debt: 2011-23
- 30. TNOs by total cash and short term investments ($M): 2011-23
This report reviews the growth and development of the telecommunications network operator (TNO, or telco) market. The report tracks a wide range of financial stats for 140 telcos across the globe, from 1Q11 through 3Q24. For the annualized 3Q24 period, telcos represented $1.77 trillion (T) in revenues (0.1% growth YoY), $262.4 billion (B) in labor costs (0.8% YoY), and $294.6B in capex (-7.7% YoY). They employed approximately 4.45 million people as of September 2024, down 1.5% from the prior year.
VISUALS
Below are a few highlights from the report:
Revenues: Telco topline grew slightly by 0.8% on a YoY basis to post $441.4 B in the latest single quarter ending 3Q24. Revenues for the annualized 3Q24 period were $1,770.6B, up 0.1% YoY over the same period in the previous year. At the operator level, five of the top 20 telcos by topline growth in 3Q24 on an annualized basis include Airtel (4.6%), America Movil (4.3%), STC (Saudi Telecom) (4.2%), Deutsche Telekom (3.3%), and BT (2.5%). By the same criteria, the worst telco growth came from Vodafone (-6.8%), KDDI (-5.7%), NTT (-5.0%), SoftBank (-3.6%), and BCE (-1.6%) during the same period. Note that exchange rate volatility was NOT a major factor in 3Q24, as most major currencies were relatively stable versus 3Q23 levels.
Capex: Capex spending declined by 6.1% on a YoY basis to post $71.1B in the latest single quarter ending September 2024. Capex for the annualized 3Q24 period was $294.6B, down 7.7% YoY over the same period in the previous year. At the operator level, five of the top 20 telcos by capex growth in 3Q24 on an annualized basis include BSNL (300.6%), Telstra (52.3%), BT (4.8%), NTT (3.0%), and China Mobile (1.9%). By the same criteria, the worst capex growth came from Reliance Jio (-27.4%), Verizon (-22.5%), Vodafone (-20.0%), Deutsche Telekom (-18.1%), and KDDI (-16.3%) during the same period.
Opex and labor costs: Total opex for the telecom industry in the annualized 3Q24 period stood at $1,507.9B, a slight increase of 0.9% over the same period in the previous year. Excluding depreciation and amortization (D&A) costs, opex increased by 1.7% on YoY basis to record $1,179.4B in the annualized 3Q24 period. One significant element of telco opex is labor costs, which include salaries, wages, bonuses, benefits, and retirement/severance costs. Labor costs grew by 0.8% YoY in the annualized 3Q24 period, while labor costs as a percentage of opex (ex-D&A) was 22.2% in the same period.
Profitability margins: Both EBITDA and EBIT margins showed a slight decline in annualized 3Q24 compared to 3Q23. The annualized EBIT margin dipped from 15.5% in 3Q23 to 14.8% in 3Q24, while the EBITDA margin for the annualized 3Q24 period stood at 33.4%, down from 34.5% in annualized 3Q23.
Regional trends: The Americas retained its position as the largest revenue-generating region in 3Q24, contributing 37.2% of global telco revenues, closely followed by Asia with a 36.4% share. On a capex basis though, Asia emerged as the top spender, claiming 38.2% of global capex and outpacing the Americas; this is a change from 3Q22 and 3Q23, when Americas ranked #1 on the back of 5G spending by AT&T and Verizon. Europe retained the highest annualized capital intensity, reaching 17.8% in 3Q24, followed by MEA at 17.0%.
Important note: We have made some significant enhancements to our telco market review report in 1Q24. The changes are designed to provide a more insightful and user-friendly experience:
- 'Market Snapshot' Tab:This tab now features an interactive dashboard view of the telco market, allowing users to interact with and analyze market data more effectively. Additionally, users can export the dashboard to PDF for convenient sharing and reference.
- Two distinct sections have been created from the previous 'Company Deepdive & Benchmarking' section for greater clarity and functionality:
- 1.'Company Drilldown': Provides a comprehensive analysis of a selected company from the full set of 140 telcos. It covers various metrics including revenue, capex, employee counts, costs, profitability, cash and debt levels, and key ratios.
- 2.'Company Benchmarking': Focuses on a sample of 79 telcos, representing approximately 82% of the global market. This section allows users to select and compare up to 5 telcos across multiple metrics such as labor costs, opex, EBIT, as well as revenues, capex, and employee counts. The sample includes operators from all regions and of varying sizes.
Both new sections also feature the capability to export graphics to PDF, enhancing the flexibility and utility of the data presented.
Operator coverage:
|
|
Regional coverage:
|
|
Table of Contents
- 1. Report Highlights
- 2. Summary
- 3. Market snapshot
- 4. Analysis
- 5. Key stats through 3Q24
- 6. Labor stats
- 7. Operator rankings
- 8. Company drilldown
- 9. Company benchmarking
- 10. Country breakouts
- 11. Country breakouts by company
- 12. Regional breakouts
- 13. Raw Data
- 14. Subs & traffic
- 15. Exchange rates
- 16. Methodology & Scope
- 17. About